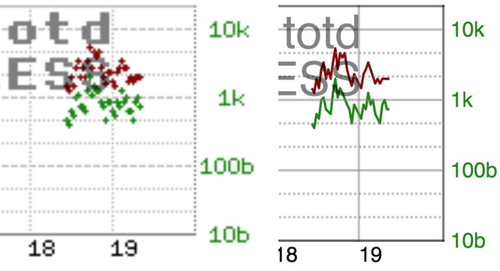
Among many other smaller changes, version 1.46 brings our well-loved CQM graphs in svg format.
The SVG graphs show the same date, just now in SVG format. This makes the graphs look sharper on higher resolution displays and they also load faster then PNGs especially if you have a lot of images to load.
Here is a comparison of the two formats:

A timeline of software releases since version 1.00 of the FB2x00 series through to today. Use your mouse to zoom and scroll.